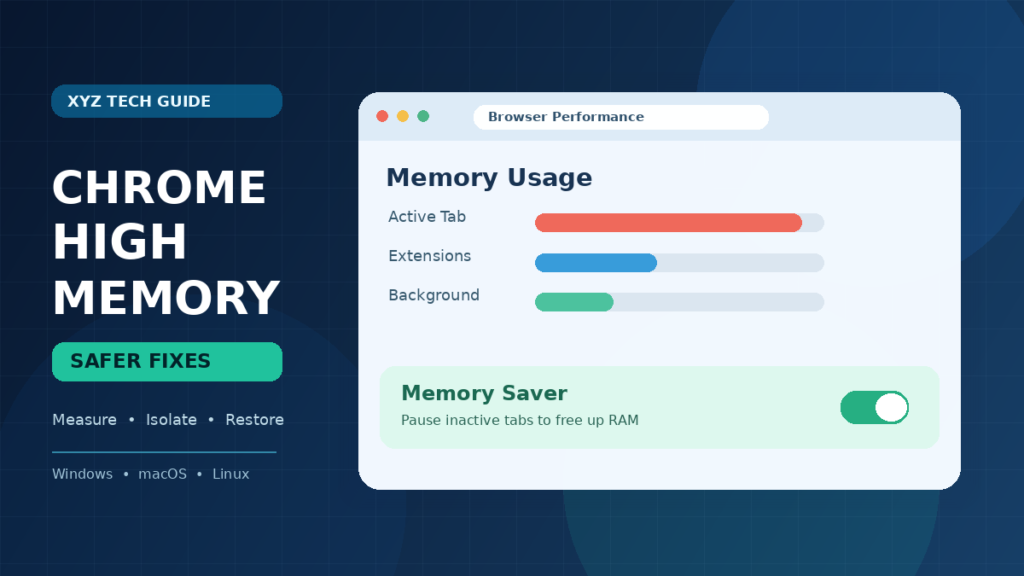

Google Chrome can use several gigabytes of memory without any one tab looking unusually busy. That does not automatically mean it is broken, and deleting a browser profile is not a sensible first fix. This guide explains Chrome high memory usage using practical measurements, the official Memory Saver controls and safe, reversible troubleshooting on Windows, Mac and Linux. It focuses on how to tell a genuine resource problem from normal browser behavior while protecting open documents, sign-ins and local data.
Quick Answer: Start by checking whether the computer is actually slow, swapping or showing memory errors. Open Chrome More tools > Task manager and sort by memory, then compare with the operating system’s total memory pressure. Close unnecessary tabs after saving work. Under Settings > Performance, turn on Memory Saver and try Balanced if offered. Recheck the same workload before and after each change. Avoid deleting profiles, clearing all cookies, disabling browser security or installing untrusted RAM boosters.
Why Chrome Can Use So Much Memory
Chrome runs tabs, extensions and browser features in multiple processes to improve isolation and stability. That design can make several Chrome entries appear in your operating system’s task manager even when you see only a few browser windows. Memory use grows with interactive websites, embedded video, large documents and open tabs. It may also change as the browser caches information to make future actions quicker. A large memory number alone does not establish a defect. The real question is whether other applications become sluggish, the computer runs short of available memory, Chrome shows an out-of-memory error or a process continues growing without a reasonable explanation. Google’s performance troubleshooting guidance recommends identifying affected processes rather than treating every Chrome instance as suspicious.
Understand Memory Use Versus Memory Pressure
Memory usage describes how much RAM processes report using, while memory pressure is the effect that demand has on the whole system. Windows and macOS can use free RAM for caching and reclaim it when applications need space. Therefore, a screenshot showing several gigabytes associated with Chrome does not tell the whole story. Look for repeated freezes, heavy swapping, slow application switching or memory-related errors during normal work. Compare measurements before and after closing an especially demanding tab. On macOS, Apple’s Activity Monitor memory guide explains why its Memory Pressure display is more informative than a simple free-memory total. Avoid assuming that one number means every user needs more RAM.
Identify The Symptom Before Changing Any Setting
Different symptoms call for different tests. If Chrome starts quickly but a particular website freezes, investigate that page. If the browser slows after many hours, observe whether memory grows steadily with a fixed set of tabs. If the whole computer becomes unresponsive, check total system resources as well as Chrome. If one extension appears unusually active, isolate it separately. Record the operating system, Chrome version, open tabs, approximate memory use and the task that fails. Do not clear browsing data or reset profiles before you understand the problem. A controlled observation helps distinguish a temporary workload spike from an ongoing resource issue. It also makes later comparisons meaningful instead of allowing every random restart to appear like a permanent repair.
Use Chrome Task Manager Instead Of Guessing
Open Chrome’s menu, select More tools and Task manager where available, then examine the Memory column. Google’s Speed up Chrome instructions describe sorting by memory to identify demanding tasks. Depending on platform and release, the interface can show tabs, extensions, utilities and other background processes. Give a large task time to settle if a site is still loading, then see whether the memory number remains high. Chrome Task Manager is more useful for browser-specific isolation than trying to interpret every Chrome process name in Windows Task Manager. Our guide to high-memory Chrome tabs covers detailed per-tab inspection; this article concentrates on system-wide troubleshooting and Memory Saver decisions.
Read The Memory Column In Context
Sorting tasks by memory can reveal the biggest current consumer, but it does not identify why that task needs resources. A video editor inside a webpage, a collaboration dashboard or a large spreadsheet can use more memory than a simple text article for legitimate reasons. Compare the same tab after the page finishes loading and after the workload is idle. Do not judge a single number without knowing whether it changes over time. Some browser processes support multiple sites or shared services, so ending them may affect more than the currently visible tab. Keep an unsaved-work checklist before using End process. A reproducible high-memory task is a lead for diagnosis, not proof that the website is malicious or Chrome is broken.
Compare Chrome With Windows Task Manager
On Windows, press Ctrl + Shift + Esc to open Task Manager, then inspect overall memory use and the applications consuming it. Microsoft’s PC performance guidance describes monitoring CPU, memory and disk activity when a system is slow. Compare Chrome’s numbers with resource use by games, virtual machines, editing software and background services. Windows may present multiple Chrome processes, and summary totals may not match a simple addition of every visible row because memory metrics can account for shared and private pages differently. Observe overall pressure as well as one application. Avoid terminating unrelated system processes or disabling security services because Chrome seems to occupy a large portion of installed RAM.
Check Memory Pressure On A Mac With Activity Monitor
On macOS, open Activity Monitor, choose Memory and inspect the Memory Pressure graph alongside app memory and swap behavior. Apple’s official Activity Monitor guide provides the starting point. An apparently small amount of free memory is not enough to diagnose a problem because macOS uses memory for caches and system activities. Look for sustained high pressure while doing your ordinary work and compare behavior when an unnecessary Chrome tab is closed. If another program is the major consumer, focus on that application instead. Do not use Terminal cleanup commands that claim to force all memory into a free state. Reliable performance is more important than an artificially large free-RAM number.
Close Unused Tabs Without Losing Important Work
Inactive tabs can accumulate over weeks, particularly when a browser restores the previous session at startup. Google recommends closing tabs you do not need as an ordinary speed improvement. Before closing a tab, save unfinished documents, unsent forms, downloads and other work that may not survive a reload. Bookmark or organize research pages that you still need later. After closing a small group of idle tabs, recheck overall memory and system responsiveness. If performance improves, you have identified an actionable contributor. If nothing changes, do not start deleting all browsing history as a reflex. A small measured change is more informative than closing fifty tabs at once and forgetting which one contained the underlying issue.
Turn On Memory Saver Through Chrome Settings
Chrome provides Memory Saver under Settings > Performance. Google’s current official documentation explains that the feature deactivates eligible inactive tabs so active tabs can run more smoothly. When you return to an inactive tab, Chrome reloads it. This feature can reduce avoidable memory use without erasing your bookmarks or removing your profile. Start with a balanced setting where your version offers several levels. Revisit a tab after a few minutes to understand its behavior before relying on the feature during critical work. Do not assume Memory Saver will lower memory used by an actively running heavy video call, game or web editor. It addresses eligible inactive tabs rather than every possible source of memory pressure.
- Measure: Check system pressure and Chrome Task Manager while the problem occurs
- Isolate: Identify the tab, extension or workload with reproducible resource use
- Adjust: Close unused tabs or enable the supported Memory Saver setting
- Retest: Repeat the same activity and compare memory pressure and responsiveness
- Restore: Undo unsuccessful adjustments and preserve browser profiles and account data
Choose Moderate Balanced Or Maximum Deliberately
Google documents three Memory Saver levels in supported Chrome builds: Moderate, Balanced and Maximum. Moderate keeps tabs active longer, Balanced provides a middle ground and Maximum deactivates eligible idle tabs sooner. These labels describe tradeoffs, not guaranteed RAM percentages. A laptop with many reference tabs might benefit from a stronger setting, while someone frequently switching between active research pages may prefer fewer reloads. Begin with Balanced when present, observe normal work and adjust only if the benefit outweighs interruptions. The best setting depends on your workload, tab behavior and computer memory. If your organization controls Chrome performance settings, follow its policy. An option absent from your interface may reflect an older or managed installation rather than an error.
Understand Which Tabs May Stay Active
Memory Saver does not deactivate every background tab under all conditions. Google’s documentation lists activities that can prevent deactivation, including active audio or video, screen sharing, downloads, partially filled forms, certain notifications, pinned tabs and connected-device interactions. That explains why an inactive-looking tab may continue consuming RAM. Do not force-close a page that is recording a meeting or transferring an important file simply because it remains active. Instead, decide whether the activity is needed and complete it normally. A high-memory tab that is protected from deactivation can be behaving as designed. Verify the activity and compare it with a truly idle tab before claiming Memory Saver is malfunctioning.
Keep Essential Work Sites Active Carefully
Chrome’s Performance settings include an Always keep these sites active list in supported builds. Google’s Memory Saver documentation explains that users can add current sites or specify addresses manually. This can be appropriate for an active dashboard, a live work application or a page where losing local state would be disruptive. However, every exclusion can reduce memory savings, so do not exempt all websites by default. Add only the sites that need uninterrupted background behavior, verify their function and review the list periodically. For a managed corporate browser, ask the administrator before changing restricted settings. A narrow exception is safer than completely disabling a helpful memory-management feature.
Use Tab Hover Memory Information When Available
Supported Chrome desktop versions can show memory use in a tab’s hover preview. Google’s Performance help explains where to enable the display through Appearance settings, with some menu differences across Windows, Mac, Linux and Chromebook platforms. This can make a heavy tab easier to spot without continually opening the dedicated Task Manager. Treat it as a quick indicator rather than a full system diagnostic. The displayed value can fluctuate as the page loads, runs scripts or responds to user activity. If one tab is consistently high, inspect it in Chrome Task Manager and determine whether the page’s actual workload justifies the number. Do not compare the value mechanically with another browser that reports memory in a different way.
Separate Memory Saver From Energy Saver
Memory Saver is aimed at reducing memory occupied by eligible inactive tabs. Energy Saver addresses battery consumption and can alter certain visual or background activities. The two settings are not interchangeable, and turning on Energy Saver will not necessarily solve a browser that is running out of RAM. Google’s Performance help covers the distinct controls and notes that some supported devices use Energy Saver automatically when unplugged or running low on battery. Check which symptom matters to you: lagging tab switches, low battery, video smoothness or memory errors. Change only the relevant setting and observe results rather than enabling every optimization without a plan.
Know Why Page Preloading Is A Separate Choice
Chrome can preload pages to make likely future navigation feel quicker. This feature may consume network resources and memory depending on workload, but it is different from the mechanism that deactivates inactive tabs. Google documents standard and extended preloading options in the Performance area. If you are diagnosing resource use, note whether preloading is enabled and compare behavior under controlled conditions. Do not tell every user to turn it off as a universal speed improvement because the tradeoff can be slower navigation. Consider the privacy and connectivity details in Google’s official explanation before altering the setting. A reversible comparison on a familiar workflow is more useful than applying a one-size-fits-all browser tuning checklist.
Watch For Extensions That Work In The Background
An extension can run scripts or background activities even when its toolbar button is not visible. In Chrome Task Manager, look for extension-related tasks with sustained memory or CPU use and observe whether activity follows a particular site. Temporarily disable one nonessential extension at a time and compare the same workload. Do not remove a password manager or workplace security add-on without understanding the consequences. Our extension performance troubleshooting guide provides a detailed isolation method. A large memory number alone does not prove an extension is unsafe; some legitimate tools process complex pages. The test should identify repeatable resource use, not simply label all extensions as bad.
Distinguish A Heavy Website From A Memory Leak
A large page can legitimately allocate memory while processing high-resolution images, interactive documents or streaming media. A memory leak is a different behavior in which unnecessary memory remains allocated over time and may grow despite repeated completion of the same task. Consumer task managers cannot prove a leak from one snapshot. Record memory at comparable intervals while leaving the workload stable, and note whether closing the page releases resources and restores responsiveness. If the pattern appears only on one site, report it to that site’s developer with a reproducible sequence. Avoid installing questionable memory-cleaner extensions that promise to repair arbitrary website code. A careful timeline is more persuasive than an isolated high number.
Test A Single Site In A Clean Comparison
When you suspect one page, first save your work and close unrelated tabs. Record approximate memory with the site open and when it is closed, then reopen it and repeat the same ordinary interaction. If the site is consistently the major consumer, check its own performance settings, content size and update state. A live video conference, map application or browser-based design tool may have unavoidable requirements. Do not publish a site’s name as the cause of a memory leak without repeatable evidence. If another browser displays the content differently, remember that the engines and reporting methods may differ. The useful result is whether your real task can be completed reliably on the current machine.
Review Chrome’s Performance Issue Alerts
Chrome can display performance issue notifications that suggest deactivating tabs when browsing becomes sluggish. Google documents these alerts and a Fix now action in supported versions. Treat a notification as a prompt to inspect the active workload, not as proof of malware or hardware failure. Before accepting tab deactivation, confirm whether you have unsaved forms, online meetings or live dashboards that should remain running. If you prefer not to receive the suggestions, the official Performance settings include an alert control. Disabling the alert does not solve the underlying memory pressure; it only changes the browser’s messaging. Observe what happens after a documented action and keep important work protected.
Update Chrome Through Its Official Channel
Google recommends keeping Chrome updated for security and compatibility. Open the browser menu and choose Help, About Google Chrome where supported, then allow a legitimate update to finish and relaunch at a suitable time. Google’s Chrome update instructions explain the supported process. Save unsent forms and active work before relaunching. An update can address bugs that affect performance, but it cannot guarantee lower memory use for every website. Avoid fake update pop-ups and third-party installers. If an organization manages Chrome, work with the administrator rather than bypassing the approved update schedule. Record the old and new version numbers if you are evaluating a persistent symptom.
Check Whether Chrome Has An Out-Of-Memory Error
A tab displaying an out-of-memory message, repeatedly crashing or closing unexpectedly is more concrete than a large but stable RAM figure. Google’s Chrome crash and launch guidance includes steps for cases where the computer runs out of memory while other apps, tabs and extensions are open. Save other work, close unneeded applications and restart Chrome normally before trying more disruptive remedies. If the issue recurs in one site, isolate that page. If all browsers and applications exhibit similar failures, investigate system-level memory pressure or hardware reliability. Do not assume that deleting browsing data will provide a durable fix for insufficient physical RAM.
Use Windows Memory And Disk Measurements Together
When RAM fills, the operating system may move some memory contents to storage, a process that can make application switching feel slow. Windows Task Manager provides a high-level view of memory, CPU and disk activity. Microsoft’s performance guidance recommends monitoring these resources together. If disk activity remains high while multiple apps stall, record whether memory pressure coincides with the behavior. Do not manually disable the paging file or use registry tweaks offered as generic Chrome optimizations. Virtual memory settings are system-level controls and usually should remain under supported management. For terminology, our cache memory explanation separates different caches and memory layers.
Assess Computer RAM Against Your Actual Workload
The amount of installed RAM matters, but recommending a particular upgrade requires knowing the applications you run together. A system used for ordinary reading behaves differently from one running a video conference, many documents, a virtual machine and a browser-based editor at once. Compare the machine’s total capacity with sustained memory pressure during your normal busiest period, not a single idle desktop reading. On some modern laptops memory cannot be upgraded, while other systems have compatible replaceable modules. Verify the manufacturer’s specification before buying hardware. If closing unused tabs makes the system responsive again, a settings adjustment may be sufficient. If legitimate workloads consistently exceed capacity, hardware may be worth considering after the diagnosis.
Test A Normal Chrome Restart Before A Reset
Save open web forms, uploads and browser-based documents, then close Chrome normally and relaunch it. A restart can release temporary process state and gives you a fresh baseline for observing memory growth. If Chrome restores the full previous session, note how many tabs return before measuring results. Repeat the original task rather than deciding the problem is fixed merely because the initial memory number is lower. Do not repeatedly force-quit the browser during downloads or online meetings. If memory pressure returns after a predictable time, document that pattern. A normal restart is a low-risk diagnostic action, while profile removal and clearing storage can erase useful information without addressing the true cause.
Understand When A Fresh Profile Test Helps
If high resource use occurs only in your usual browser profile, a separate temporary profile can help determine whether extensions, custom settings or stored site activity contribute. Create it through Chrome’s supported profile chooser, keeping the original untouched. Do not delete your normal profile or assume that Google Account sync includes every local bookmark, passkey or session. Our Chrome profile preservation guide explains the data risks in more detail. A fresh profile may have fewer extensions and no signed-in web apps, so its memory use is not directly comparable unless you reproduce similar tasks. Use it as an isolation test and return to the original profile after gathering evidence.
Do Not Clear All Browsing Data To Free RAM
Browser cache, cookies, saved passwords and history are different things from live RAM allocations. Deleting cached site data may save storage space but can require websites to fetch resources again, end signed-in sessions or remove useful offline information. It is not a universal remedy for a browser with many active processes. If a particular site behaves incorrectly, use narrowly targeted official troubleshooting and preserve important account access. Our browser cookie guide explains the purpose and privacy implications of site data. Avoid cleanup utilities that claim they can make Chrome use almost no RAM without affecting functionality. Focus on measured active tasks and Memory Saver instead.
Avoid Random Flags And Registry Memory Tweaks
Online lists sometimes recommend experimental Chrome flags, undocumented switches or Windows registry edits to force reduced memory usage. Their effects may change between releases, break websites or weaken isolation, and they rarely provide a verifiable universal improvement. Prefer official Chrome Performance controls, supported updates and reversible tests. Do not disable process isolation or browser security features as an attempted shortcut. If an advanced change is recommended by a trusted administrator for a specific environment, document the old value, reason and rollback procedure. Ordinary readers should not need undocumented commands to identify a heavy tab. Reliable browser behavior and preserved data matter more than an aggressive benchmark screenshot.
Know When Graphics Or Video Tasks Affect Memory
Browsers allocate resources for images, video decoding, compositing and graphics-heavy web apps. Some of that usage may appear in GPU-related processes rather than the tab you suspect. If a problem occurs only with video calls or graphics-intensive pages, record the browser and graphics driver versions, CPU activity and any visible rendering defects. Do not disable graphics acceleration permanently without evidence that it is implicated, because doing so can worsen performance or video smoothness on some systems. If an approved troubleshooting procedure suggests a temporary comparison, change one variable and then restore the setting if the result is inconclusive. A high GPU-process number is a clue to investigate, not proof that the graphics card is failing.
Check Security If Browser Behavior Is Unexpected
Unfamiliar extensions, redirected search results, surprise download prompts or new browser policies can justify a separate security review. Google’s unwanted software guidance documents warning signs and supported cleanup approaches. High Chrome memory alone is not evidence of malware. Use reputable built-in operating system protections and Chrome’s official extension management interface rather than installing an unknown browser ‘RAM booster.’ On managed devices, security tooling and policies may be deliberate. If you suspect credential compromise, change passwords through the legitimate service and follow account recovery instructions separately. Do not remove security software or expose browsing data simply to obtain a lower memory reading.
Use A Symptom And First-Test Decision Table
A browser using substantial memory but running normally may not require a fix. Repeated out-of-memory errors warrant checking system load and unused tabs. A single heavy website points toward site-specific behavior, while a busy extension merits controlled isolation. The table below pairs observable symptoms with reversible first checks and avoids assigning causes from one reading. Run a test only when you can observe its outcome and preserve important work. For example, if Memory Saver helps after idle tabs accumulate, that is evidence for the particular workload, not proof that it will improve a live video conference. Keep enough detail to reproduce the issue later without resetting unrelated settings.
| Observed Symptom | Possible Explanation | Best First Test |
|---|---|---|
| High RAM Use, Everything Runs Normally | Legitimate Active Workload Or Caching | Monitor Without Changing Settings |
| Slow After Many Idle Tabs | Unused Tabs Occupy Resources | Close Unused Tabs Or Use Memory Saver |
| One Page Consistently Grows | Demanding Site Or Possible Leak | Repeat The Same Site Test |
| Extension Task Remains Busy | Extension Background Work | Disable One Nonessential Extension |
| Whole System Freezes Or Swaps | Broader Memory Pressure | Compare Windows Or macOS Resource Views |
| Only Video Pages Stutter | Media Or Graphics Workload | Observe GPU And CPU Activity |
Build A Short Before-And-After Measurement Record
Write down the Chrome version, operating system, total installed RAM, number of tabs, approximate memory use and the activity that fails. Measure once under your normal problematic workload, then make one reversible adjustment such as closing unused tabs or enabling Balanced Memory Saver. Repeat the same activity and note responsiveness, not just the displayed megabytes. If your work includes video conferences or development environments, keep that consistent between tests. A six-line log from two sessions can be more informative than dozens of screenshots taken under different conditions. Avoid claiming a fixed percentage improvement based on one anecdotal result. Performance varies with hardware, websites and concurrent applications.
Recognize When The Browser Is Not The Main Bottleneck
A computer may feel slow because storage is nearly full, a system update is running, a game uses most of the GPU or another application consumes substantial RAM. Chrome’s multiple processes can attract attention simply because they are easy to see. Compare the browser’s resource use with the system’s overall CPU, memory and disk charts. If closing Chrome does not meaningfully improve the system, focus on other bottlenecks instead of resetting the browser. Microsoft’s Windows performance recommendations include broader system checks for this reason. On macOS, Activity Monitor similarly shows pressure across all processes. The goal is to determine which change restores actual work, not assign blame to the most visible application.
Decide Whether To Contact Support Or Upgrade Hardware
If the same website causes repeated crashes despite a supported Chrome version and controlled tests, collect a reproducible description for that site’s support team. If Chrome fails across profiles and ordinary sites, use Google’s official troubleshooting and the computer vendor’s diagnostics. For a managed browser, involve the organization’s IT team before changing policy or security controls. If the whole computer remains under memory pressure during legitimate work on several applications, assess compatible RAM or device options against your real needs. No hardware purchase is justified by a single task-manager screenshot alone. Preserve logs, versions and observations so the next support action has a clear factual basis.
Maintain A Stable Chrome Setup After The Fix
Keep Chrome updated through its official channel, review extensions you no longer need and choose a Memory Saver setting that matches your daily work. Revisit any Always keep these sites active exceptions because unused entries can reduce the feature’s benefit. Save critical work before closing complex tabs, and check system resource pressure only when performance changes. A browser that uses several gigabytes while completing demanding tasks reliably may not need intervention. If another slowdown develops, reproduce it with the same measured steps rather than repeating destructive resets from memory. A good maintenance habit is to change one supported control, observe the effect and leave working configurations alone.
Frequently Asked Questions
Why Does Chrome Show Many Processes In Windows Task Manager?
Chrome separates tabs, extensions and internal services into multiple processes for isolation and stability. The number of processes does not by itself prove a memory leak or malware infection.
Is Chrome Using Several Gigabytes Of RAM Always Bad?
A large number can be normal for demanding sites and many open tabs. Check whether the whole system experiences sustained memory pressure, swapping, slowdowns or out-of-memory errors before deciding there is a problem.
Where Do I Find Memory Saver In Chrome?
On supported desktop versions, open Chrome Settings, choose Performance and find Memory Saver. Google documents Moderate, Balanced and Maximum levels where available.
Does Memory Saver Delete My Tabs Or Bookmarks?
Memory Saver deactivates eligible inactive tabs and reloads them when revisited. It is not the same as deleting bookmarks or resetting a browser profile. Save unsent forms before relying on any tab-reload behavior.
What Is The Best Memory Saver Setting?
Balanced is a sensible starting point where the three levels are offered. Use Moderate when fewer tab reloads are important, or Maximum when stronger idle-tab deactivation fits your workflow.
Why Does One Tab Still Consume A Lot Of RAM?
An active website, video stream, game or complex web application may need substantial memory. Some activities also prevent tab deactivation. Check the actual workload before assuming Memory Saver has failed.
How Can I Identify A High-Memory Extension?
Use Chrome Task Manager to observe extension tasks, then temporarily disable one nonessential extension at a time. Repeat the same browser activity and compare results without removing required security tools.
Does Clearing Cache Immediately Free RAM?
Clearing disk cache and cookies is not a universal method for lowering active memory demand. It can also sign you out of sites or remove offline data, so use targeted measures only when the problem involves that stored content.
Should I Turn Off GPU Acceleration To Reduce Memory?
Not as a routine first step. Graphics-intensive sites can use GPU resources legitimately, and disabling acceleration may worsen performance. Consider only a documented temporary comparison for a specific rendering problem.
When Is High Chrome Memory A Reason To Get More RAM?
An upgrade becomes relevant when normal, necessary workloads repeatedly create sustained system memory pressure despite reasonable tab and app management. Check hardware compatibility and other bottlenecks before buying components.
Sources And Test Scope
Official guidance consulted: Google Chrome Performance Settings, Speed Up Google Chrome, Chrome Enterprise Performance Troubleshooting, Microsoft Windows Performance Help and Apple Activity Monitor. This guide reports documented behavior and reasoned tests; it does not claim hands-on measurements on readers’ devices or guaranteed percentage reductions in RAM use.